
USCIS denied 86,333 naturalization applications in fiscal year 2024, a denial rate of roughly 9.6 percent of all applications it decided that year. That figure moves from year to year, and different sources report different numbers for the same year because they calculate it differently. This post walks through the current number, shows the math behind the conflicting figures you will find elsewhere, and covers why applications get denied and what a firm can do about it.
Key Takeaways
- USCIS denied 86,333 naturalization applications in FY 2024, about 9.6 percent of the 902,513 applications it adjudicated.
- Published denial rates for the same year often disagree because sources use different denominators, which we break down below so you can verify any figure you cite.
- Monthly data from September 2025 through February 2026 shows the denial rate climbing from about 9 percent to nearly 16 percent as total approvals fell by roughly two-thirds.
- The most common grounds for denial are gaps in continuous residence or physical presence, failing the English or civics test, and good moral character issues.
How Many Naturalization Applications Are Denied Each Year
In fiscal year 2024, USCIS approved 816,180 naturalization applications and denied 86,333, according to USCIS quarterly performance data for Form N-400. That works out to a denial rate of 9.6 percent of the 902,513 applications it adjudicated that year. We use this figure, denials divided by total decisions, throughout this article, since it answers the question most readers actually mean to ask: of the cases USCIS decided, how many ended in denial.
Why You'll See Different Percentages Elsewhere
Search for this number elsewhere and you will find several different answers for what looks like the same year: 8.6 percent, 9.6 percent, 10.6 percent, 11 percent, 13 percent. None of these figures is necessarily wrong on its face. Most are answering a slightly different question using the same underlying FY 2024 numbers, and the difference comes down to which two figures get divided.
Some figures describe a single quarter, not the full fiscal year, but get repeated as if they were an annual rate.
Ask what the denominator is before repeating a headline percentage, and state your own denominator when you publish a figure. That single habit resolves most of the disagreement you will see across sources.
Two Ways USCIS Counts Naturalizations
Part of the confusion also comes from USCIS tracking naturalization through two separate systems:
- Quarterly Form N-400 performance data, used above, which counts applications approved or denied during each quarter.
- DHS's annual naturalization flow reports, which count persons who completed their oath ceremony in a given year.
The two totals will not match exactly in any single year, since an application approved late in one fiscal year may not reach an oath ceremony until the next. Both are official sources, but note which one you are citing when you publish a figure.
The Naturalization Denial Rate Over Time
With the denominator settled, here is how the rate has actually moved since 2018. Denial counts have gone up and down rather than trending steadily in one direction. The table below uses figures published in DHS's Yearbook of Immigration Statistics and its annual flow reports, plus the most recent quarterly figures from USCIS.
*The 2022 and 2023 denial counts come from the Yearbook of Immigration Statistics, which does not publish a matching total-adjudications figure for those years in the same table, so we show the raw denial count rather than estimate a rate from a different denominator. The 2026 Q1 row covers one quarter, not a full fiscal year, so its scale is not directly comparable to the full-year rows above it, though the calculation method is the same.
Denial counts topped 100,000 in both 2022 and 2023, even though the rate calculated for 2018, 2020, 2024, and the latest quarter all stayed within a narrower 9.6 to 11.4 percent band. That consistency makes the most recent data point worth watching closely, because it breaks from the pattern.
Naturalization Outcomes, September 2025 to February 2026
USCIS reports monthly processing data to Congress, and the most recent months show a steadier climb than any single data point captures. Figures below are approvals, denials, and the resulting denial rate for each month.
Source: USCIS Report to Congress on Form N-400 processing, as compiled by a third-party tracker; we recommend confirming against USCIS's own monthly filing before republishing these exact figures.
Two things move together here. Monthly approvals fell sharply, from 71,181 in September to 23,626 in February, a drop of about two-thirds. Over the same months, the denial rate climbed from roughly 9 percent to nearly 16 percent. Total pending cases rose from 537,769 to 647,193 across the same window, and cases pending more than six months roughly doubled.
Why a Slowdown Can Skew the Numbers
When a field office completes far fewer cases than usual, the cases it does complete are not necessarily a random sample of its full caseload:
- Interviews scheduled months in advance can make up a larger share of what gets decided during a slowdown.
- Newer, more straightforward filings can get pushed back in the queue instead.
That mix can skew toward harder, more contested files, the kind more likely to end in denial regardless of any change in how USCIS applies its standards. Monthly data alone cannot distinguish that effect from an actual shift in adjudication practice, which is why we are treating this six-month climb as a trend to track rather than a settled conclusion.
Either way, the practical takeaway for a firm is the same: processing is taking longer, and a growing share of decided cases is ending in denial. Both are worth building into client timeline conversations now.
Why Naturalization Applications Get Denied
Whatever ends up driving the recent shift, the underlying reasons USCIS denies a naturalization application have stayed largely the same for years. USCIS does not publish a breakdown of denials by percentage per reason, but it does publish the eligibility requirements an applicant must meet, in the USCIS Policy Manual, and a denial almost always traces back to one of the four below.
Continuous Residence and Physical Presence
Applicants generally need five years as a lawful permanent resident before filing, or three years if married to a U.S. citizen. Within that period, USCIS requires continuous residence and enough physical presence in the country. Extended trips abroad, especially six months or longer, can break continuous residence and lead to a denial.
English and Civics Testing
Section 312 of the Immigration and Nationality Act requires applicants to pass an English test and a civics test, unless they qualify for an age or disability exception. USCIS's own FY 2024 data shows an 89.7 percent initial pass rate on both components combined, which means roughly one in ten applicants needs a second attempt or does not pass.
Good Moral Character
USCIS reviews an applicant's conduct during the statutory period, generally the five years, or three years, before filing. Certain criminal convictions, unresolved tax issues, or a failure to disclose required information can support a finding that the applicant has not shown good moral character.
Incomplete or Inconsistent Applications
Errors, omissions, or answers that conflict with an applicant's immigration file can trigger a denial or a Request for Evidence. This category sits most within a firm's control, since it comes down to preparation rather than an applicant's underlying history.
What Happens After a Denial
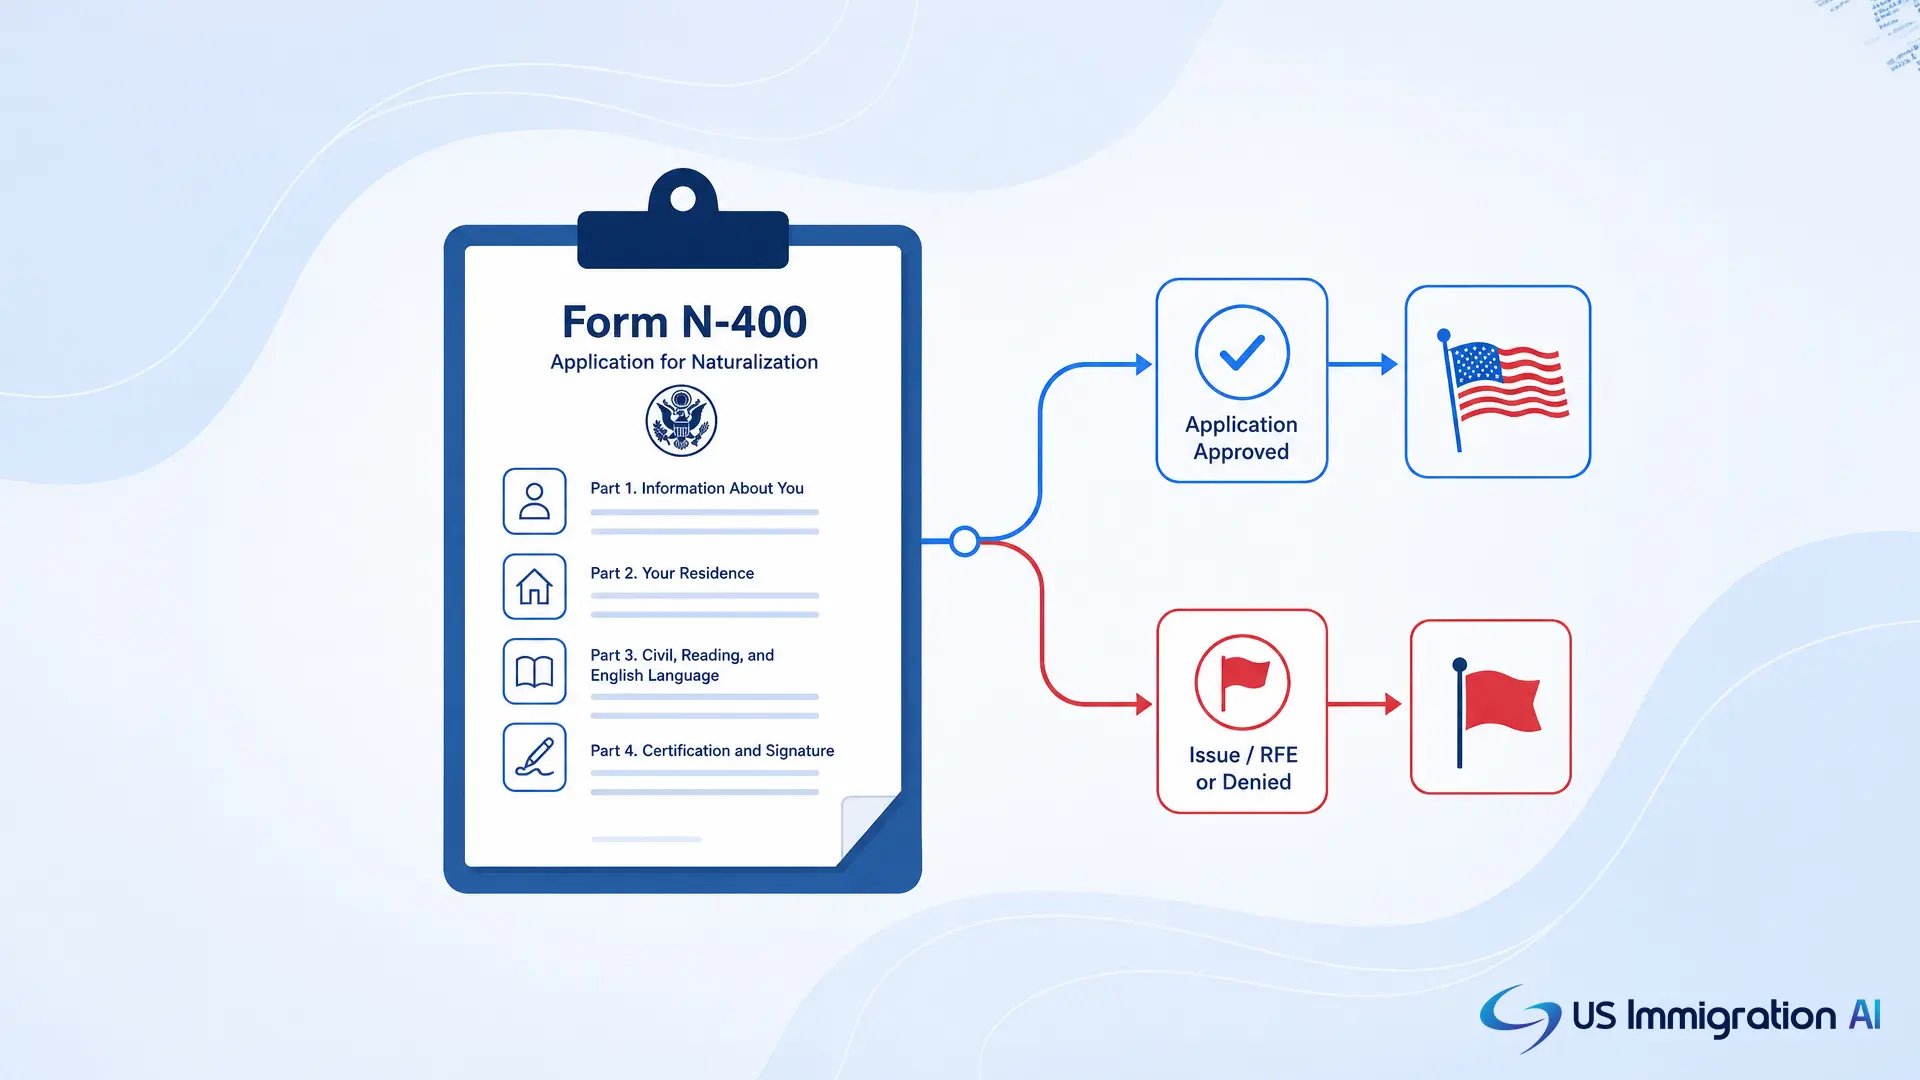
Whichever of those four issues causes a denial, the applicant's status and next steps follow the same pattern. A denial does not take away an applicant's green card. In most cases the applicant keeps lawful permanent resident status and has two paths forward, shown alongside an approval below.
Which path makes more sense depends on why USCIS denied the case:
- Testing failure: usually calls for more preparation and a refile.
- Residency or moral character finding: more often worth appealing, particularly where the facts were misapplied.
What This Means for Your Firm
Residency gaps, testing readiness, moral character issues, and application completeness, the four categories above, are also the ones a firm can catch before filing, not after an interview goes sideways. That screening matters more, not less, while processing slows and scrutiny appears to be rising.
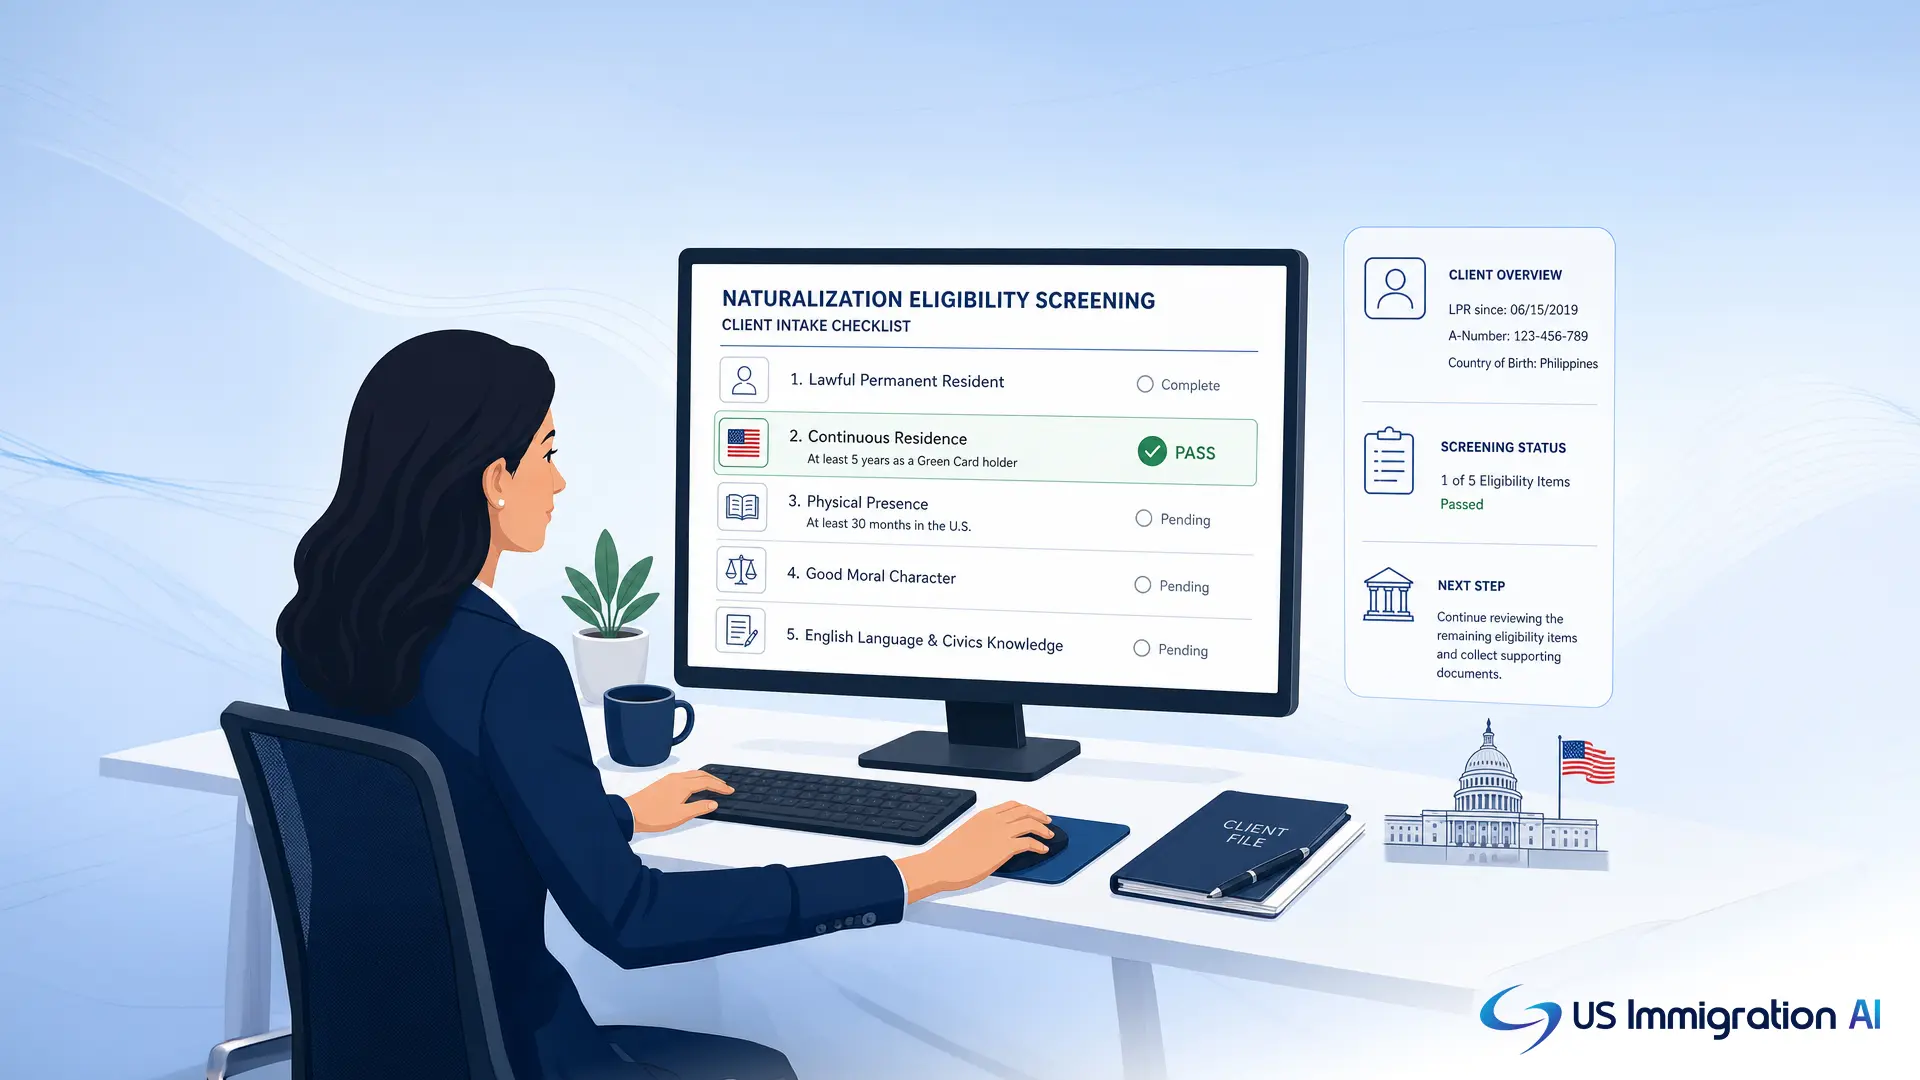
Firms that track the denial rate quarter over quarter, rather than repeating one outdated figure, can set client expectations more accurately and catch a shift in practice as it shows up in the data, not months after.
Screen Cases Before They Reach an Interview
Most preventable denials trace back to something a firm could have caught at intake. AI Intake flags likely eligibility issues, like residency gaps or prior application history, before a case moves forward, so your attorneys see the flag before the filing goes out, not after a denial notice comes back.
Frequently Asked Questions