
Asylum approval rates vary widely by state, by court, and by which of two separate systems decided the case. This guide walks through those layers in order: which system produced the number, how the national rate has moved, and then how that rate breaks down by state, court, nationality, and representation.
Key Takeaways
- EOIR recorded 879,603 total asylum applications filed in FY2025, with 2,508,982 cases pending at year's end, per DOJ data generated July 24, 2026.
- The annual immigration court grant rate has ranged from 9.9% (FY2025, partial year) to 20.7% (FY2018) since FY2015, per a Congressional Research Service analysis of EOIR data.
- The monthly grant rate fell from 38.2% in August 2024 to 19.2% in August 2025, per TRAC Immigration at Syracuse University.
- Case volume by USCIS asylum office is far from even: New York, Newark, and Chicago lead recent quarterly completions, per USCIS's own Asylum Division Quarterly Statistics Report.
- Every state falls under one of 12 USCIS asylum offices, and that map has changed recently: Atlanta and a new San Antonio office split off from existing territory in the past two years.
- California, Texas, and New York lead the country in FY2026 asylum grants, though denials outnumber grants in nearly every state.
- Judge-to-judge grant rate spreads exceed 90 points within a single court, and grant rates by nationality range from 88.4% to 11.0%, per TRAC.
- Represented applicants won relief in immigration court at a 49% rate, compared to 18% for unrepresented applicants, per TRAC's analysis of FY2021-2022 decisions.
Affirmative vs. Defensive Asylum
There are two separate asylum systems in the U.S., and they produce two separate sets of numbers.
Affirmative Asylum
Affirmative asylum is filed with USCIS by someone not in removal proceedings. A trained asylum officer conducts a non-adversarial interview. If the case isn't granted, it typically moves to immigration court instead of a flat denial. USCIS reported to Congress that affirmative filings grew from 240,800 in FY2022 to more than 454,300 in FY2023, with Cuban and Venezuelan nationals together accounting for about 39% of that year's receipts.
Defensive Asylum
Defensive asylum is raised in immigration court by someone already in removal proceedings, using the same Form I-589. This population is far larger. EOIR recorded 838,766 defensive filings in FY2025, against just 40,837 affirmative referrals into the court system that same year.
Because the defensive population dominates EOIR's data, any immigration-court grant rate mostly reflects defensive outcomes. A rate quoted without specifying which system it came from is incomplete.
National Grant Rate Trend
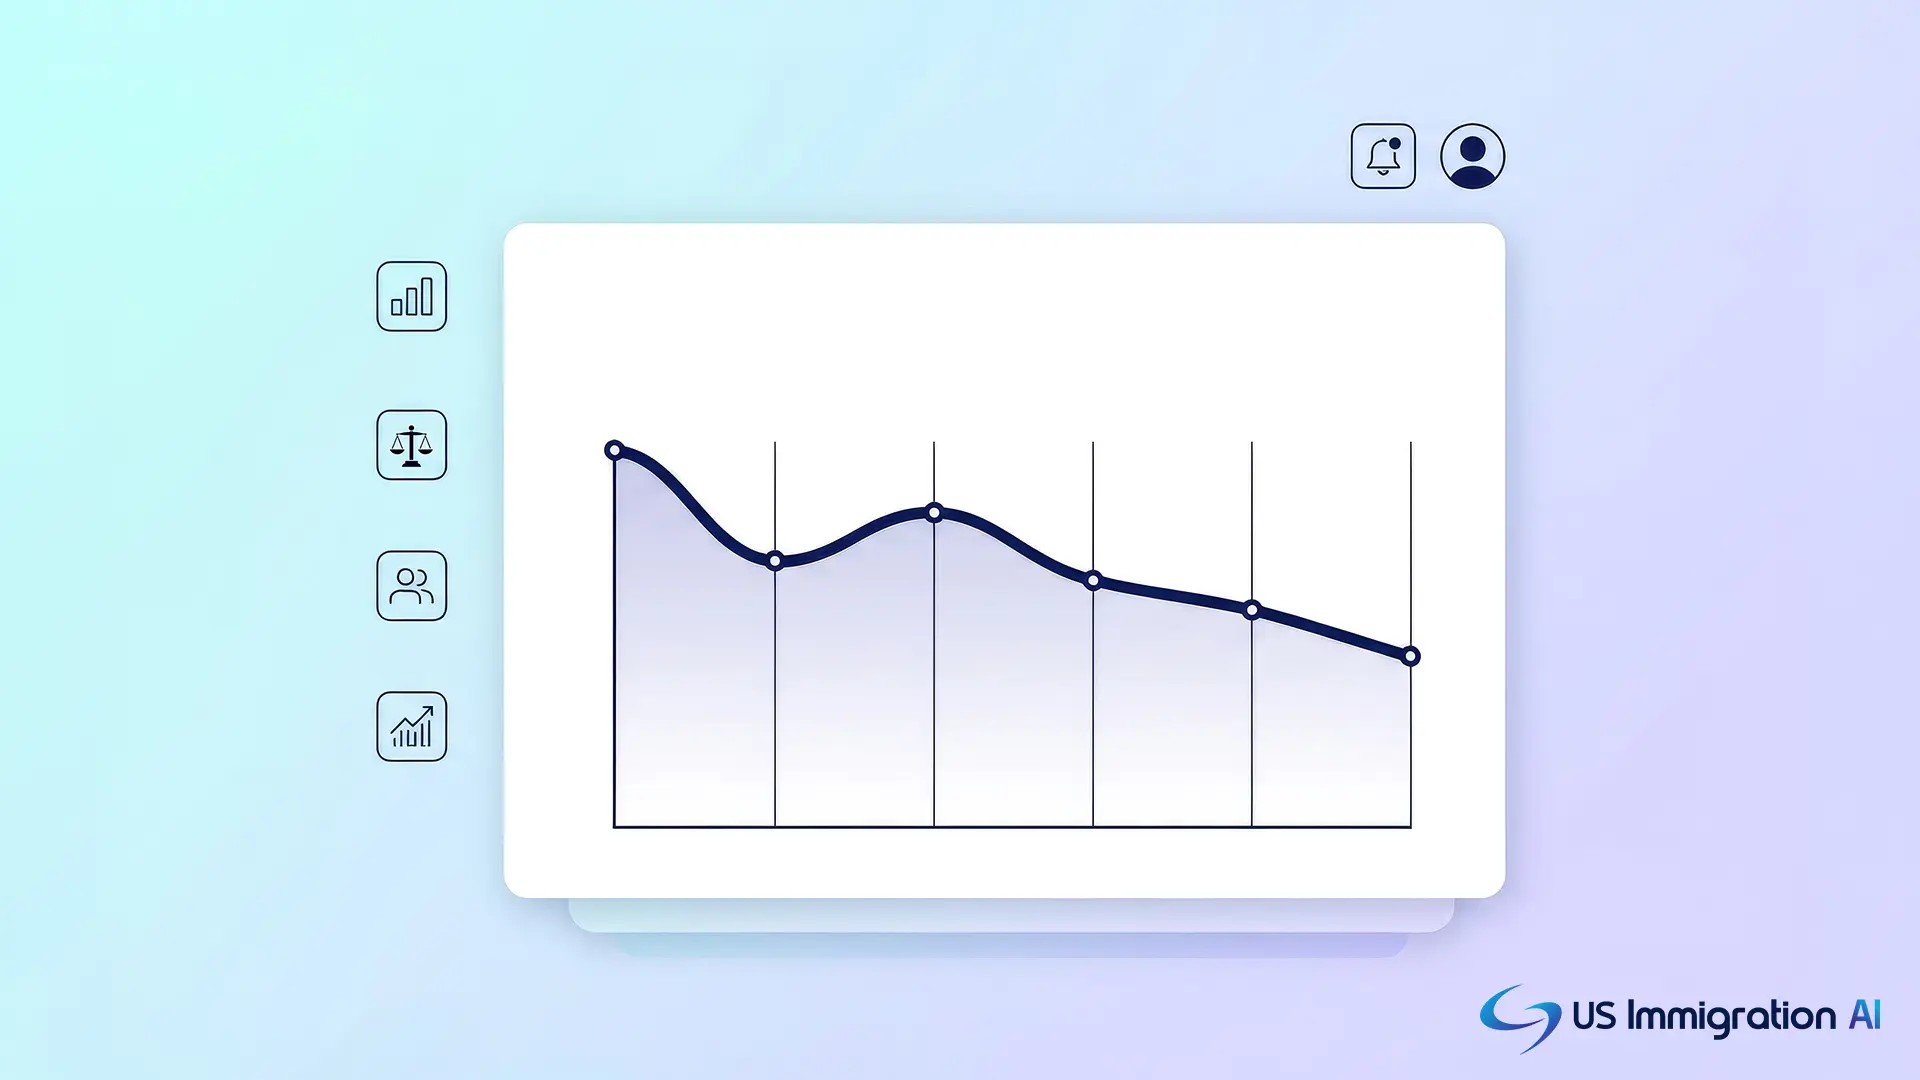
With the two systems separated, the next question is how the rate has moved over time. Since FY2015, the annual immigration court grant rate has moved within a wide band, per a Congressional Research Service analysis of EOIR data:
- Grant rate range: 9.9% (FY2025, a partial-year figure) to a high of 20.7% (FY2018)
- Denial rate range: 14.3% (FY2024) to 54.5% (FY2020)
- A growing share of cases fall into "other" outcomes, such as administrative closure or cases not adjudicated
The most recent movement has been fast. TRAC Immigration tracked the monthly grant rate falling from 38.2% in August 2024 to 19.2% in August 2025. That national number is a starting point. The next four sections break it down by geography, starting with where affirmative cases are actually processed.
Which USCIS Asylum Offices Handle the Most Cases
Affirmative cases aren't spread evenly across the country. USCIS's own Asylum Division Quarterly Statistics Report breaks down completions by office each quarter:
Source: USCIS Asylum Division Quarterly Statistics Report, FY2022 Q1 (Oct 1 - Dec 31, 2021), the most recent office-level breakdown independently verified for this piece. USCIS publishes an updated version of this report each quarter; check the current report for the latest quarter's figures before citing a specific number to a client.
Which States Each Asylum Office Covers
Office jurisdictions have shifted since that FY2022 data was collected. USCIS split Atlanta off from Arlington's territory, added a second Florida office in Tampa, and opened a new office in San Antonio in June 2026. Each office's current jurisdiction, pulled directly from its individual USCIS.gov page:
Source: individual office jurisdiction pages linked above at uscis.gov/about-us/asy, current as of April-July 2026. Note: USCIS blocks automated tools from directly loading these pages, so each link is verified only by its indexed content, not a live status check. Click-check before publishing. Newark's full state list wasn't independently confirmed beyond New Jersey and the partial counties shown; verify directly with USCIS before relying on it for a specific case. This network changes as USCIS opens or splits offices, so recheck before citing a number to a client.
FY2026 Asylum Grants and Denials by State
With the office map as context, here's what those states actually produced in outcomes. This table gives the direct grant and denial totals by state for FY2026:
Source: World Population Review, which attributes its figures to TRAC's asylum decisions data. States without an immigration court don't appear in this table. This table comes from a secondary source rather than a primary government report; verify current figures against TRAC directly before using a specific number in client-facing material.
Grant Rate by State and Court
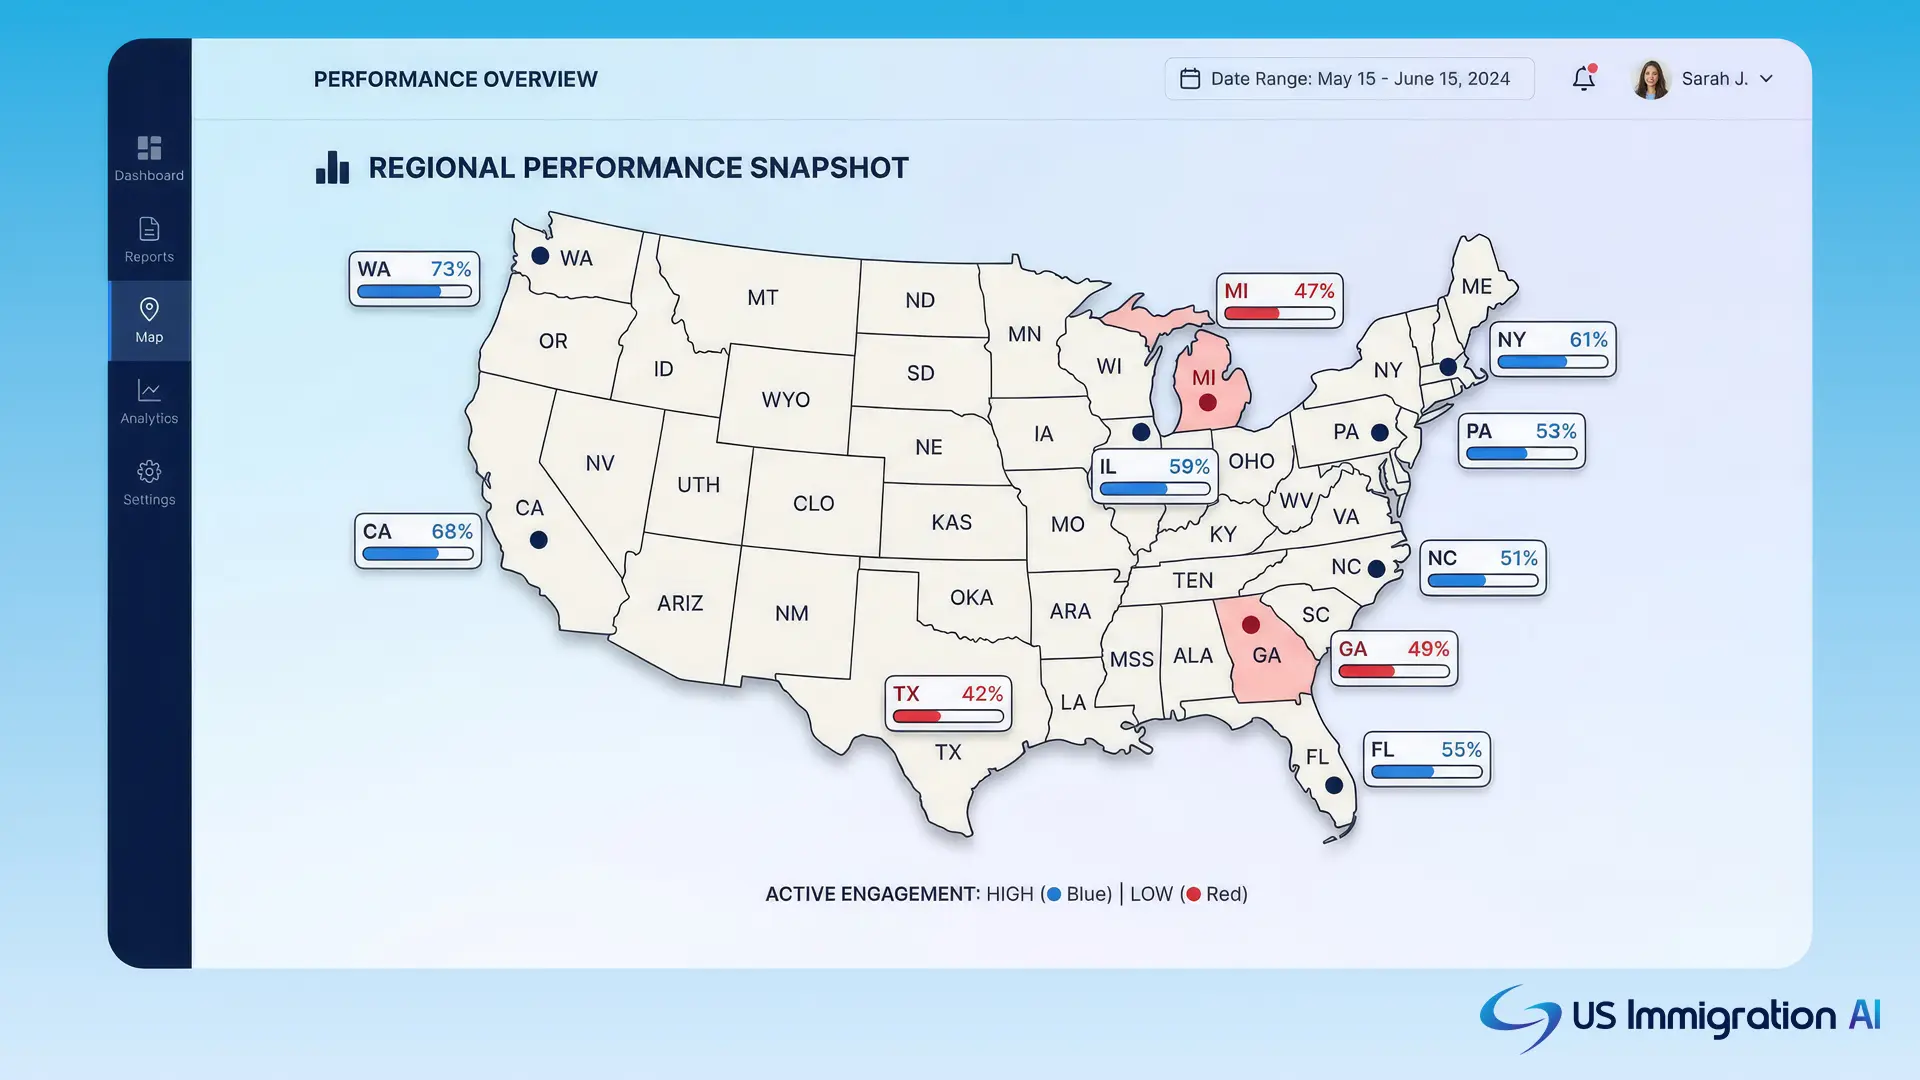
State totals only tell part of the story. Underneath each state, individual courts and judges create their own spread. TRAC's fixed report on judge-level variance shows this by court, and every court sits in a specific state:
Source: TRAC's Immigration Judge Reports, published November 18, 2025.
The spread within a single state can be wider than the difference between two different states. California holds two of the five widest spreads in this table, from courts on opposite ends of the state.
Where the Asylum Backlog Concentrates
That same court-level variance shows up in case volume too, not just outcomes. As of June 2026, TRAC's Immigration Court Quick Facts show the counties with the most pending deportation cases:
The same snapshot puts the nationwide asylum-specific backlog at 2,310,698 immigrants awaiting hearings, out of a 3,195,137-case total court backlog. Among cases completed that month, Wisconsin had the highest proportion of immigrants ordered removed of any state, and Hawaii had the lowest.
Grant Rate by Nationality
Geography is one lens on the variance. Who the applicant is turns out to matter just as much. TRAC's FY2024 breakdown, covering every nationality with at least 100 immigration court decisions, shows this range:
Eight nationalities made up over half of all FY2024 decisions, and most of those eight sat below the national average.
The Impact of Legal Representation
Geography and nationality are both outside a firm's control. Representation isn't. Across the cases TRAC analyzed for FY2021-2022, represented applicants won relief 49% of the time, compared to 18% for unrepresented applicants. That gap has held even as the overall grant rate has moved sharply in the years since.
What This Means for Immigration Law Firms
Between the state, court, nationality, and representation data above, the pattern is consistent: national and even state-level averages predict very little about a specific case. Three practices turn that into something a firm can act on.
Calibrate Case Prep to the Assigned Judge, Not the National Average
Once a defensive case is assigned to a judge, pull that judge's historical grant rate before building the evidence file. A low-grant-rate judge calls for more corroborating documentation and, budget permitting, expert testimony on country conditions.
Keep Country-Conditions Evidence Current
An asylum case can sit open for years, and evidence filed at intake can be outdated by the time a hearing is scheduled. Review and refresh country-conditions evidence at least annually for any open case. A document collection portal gives a firm one place to add updated evidence over time.
Set a Fixed Review Interval for Every Open Case
Assign each case a review point, such as every 90 days, owned by the paralegal on the file: confirm the case is still active, confirm contact information is current, and confirm no notice has been missed. Escalate any case that passes 12 months with no scheduling activity to the supervising attorney.
Keep Every Asylum Case File Organized as It Ages
AI Case Assembly organizes evidence, forms, and supporting documents into a labeled file as a case moves through the years it can take to reach a hearing, and flags what's missing before a filing deadline arrives. A licensed attorney reviews every file before it moves forward. See how case assembly works.